Represent
TacVAE encodes an eight-frame marker-displacement history into compact tactile latent maps.
Predictive Contact Guidance for Generative Robot Policies
Steering Robot Actions with Predicted Contact Consequences
Anonymous Institution
ForeTac turns action-conditioned tactile foresight into a contact-quality signal for generative action formation.
Overview film. The film introduces the four-task benchmark, action-conditioned tactile foresight, predictive guidance diagnostics, and the SR/CSR results reported in the paper.

Visually similar actions can produce contact loss, jamming, slippage, or irreversible damage, while tactile feedback may arrive after a critical transition. Contact-rich manipulation therefore requires generative policies to anticipate and evaluate whether candidate actions will produce desirable contact outcomes, then adjust action generation before execution. We present ForeTac, a predictive contact-guidance framework organized as a represent–predict–evaluate–guide loop. ForeTac encodes the current tactile state, predicts the tactile consequences of a candidate action sequence, and evaluates the predicted trajectory using a contact-quality objective learned from successful and failed physical interactions. At deployment, its gradient propagates through the tactile predictor to guide action generation while the pretrained model parameters remain frozen. We evaluate ForeTac on four real-robot tasks—planar and curved-surface wiping, card swiping, and fragile-object grasping—with diffusion and flow-matching policies. Across these tasks, ForeTac raises average task success rate from 36.3% to 71.3% and average contact success rate (CSR) from 20.0% to 66.3% compared with vision-only Diffusion Policy. Component analyses support the tactile representation and action-conditioned foresight, and show that predicted touch preserves contact-quality ordering.
TacVAE encodes an eight-frame marker-displacement history into compact tactile latent maps.
Foresight predicts a temporally aligned 16-step tactile latent trajectory from the current context and candidate action.
A task-specific objective learned from desired contact and recorded failure modes scores the predicted future.
The quality gradient propagates through Foresight into the evolving generative sampling state; parameters stay fixed.
The scorer is part of predictive contact guidance. It receives predicted tactile latents rather than the action directly, so the differentiable path is candidate action → Foresight → contact-quality objective → sampling-state update.
Eight frames of 9×9×2 marker displacement become a 16×3×3 latent map. The decoder is used for reconstruction supervision and diagnostics, not online scoring.
A three-layer action-conditioned Transformer embeds tactile tokens, proprioception, and the candidate action in a 512-dimensional space. The default horizon is 16 future latent states.
Each task has one desired-contact class and three recorded failure modes. A good-versus-bad logit margin supplies the quality signal.
Diffusion Policy and flow-matching π0.5 remain frozen. Only the current generative sampling state is updated before ordinary sampling continues.

All main task results use four real-robot tasks and 20 trials per task. SR is the fraction of trials achieving the task-specific objective; CSR additionally requires the predefined physical contact criteria.

Within the evaluated methods and protocols, predictive contact guidance improves both completion and physically acceptable execution over vision-only, direct tactile fusion, and reactive tactile baselines. The flow-matching backbone is evaluated in the second block of Table I.
| Tactile use | Method | Board | Vase | Card | Chip | Average | |||||
|---|---|---|---|---|---|---|---|---|---|---|---|
| SR ↑ | CSR ↑ | SR ↑ | CSR ↑ | SR ↑ | CSR ↑ | SR ↑ | CSR ↑ | SR ↑ | CSR ↑ | ||
| Primary comparison | |||||||||||
| No touch | DP | 50 | 25 | 55 | 35 | 10 | 0 | 30 | 20 | 36.3 | 20.0 |
| RDT | 65 | 55 | 65 | 55 | 20 | 5 | 50 | 45 | 50.0 | 40.0 | |
| Current touch | DP + Tactile Concat | 60 | 50 | 60 | 50 | 35 | 30 | 40 | 35 | 48.8 | 41.3 |
| RDP | 70 | 60 | 65 | 55 | 45 | 35 | 55 | 45 | 58.8 | 48.8 | |
| Predictive touch | DP + ForeTac | 85 | 80 | 70 | 65 | 55 | 50 | 75 | 70 | 71.3 | 66.3 |
| Flow-matching evaluation | |||||||||||
| No touch | π0.5 | 55 | 45 | 60 | 45 | 25 | 20 | 45 | 35 | 46.3 | 36.3 |
| Predictive touch | π0.5 + ForeTac | 80 | 75 | 70 | 65 | 50 | 45 | 70 | 65 | 67.5 | 62.5 |
Table I. SR is the fraction of trials achieving the task-specific objective. CSR additionally requires predefined physical contact criteria, so CSR ≤ SR. Each task uses 20 trials; averages weight the four tasks equally. The second block evaluates the flow-matching π0.5 backbone.
Key result. DP + ForeTac improves average SR/CSR over DP by 35.0/46.3 percentage points and over RDP by 12.5/17.5 percentage points. With the flow-matching backbone, ForeTac improves average SR/CSR by 21.3/26.3 points.
The complete pipeline outperforms replacing the current tactile input encoder, using prediction only as an auxiliary loss, or applying predicted-contact quality only after generation through reranking.
| Variant | Board | Vase | Card | Chip | Average |
|---|---|---|---|---|---|
| ForeTac w/ ResNetFrozen ResNet-18 with a learned linear adapter; TacVAE latents remain prediction targets. | 55/55 | 55/40 | 35/10 | 55/50 | 50.0/38.8 |
| Prediction Auxiliary Lossprediction retained only as a training objective | 60/55 | 65/55 | 40/35 | 55/50 | 55.0/48.8 |
| ForeTac w/ Predictive RerankingFixed candidate budget with the same frozen Foresight and scorer; no gradient into sampling. | 65/60 | 65/60 | 45/35 | 60/55 | 58.8/52.5 |
| ForeTac | 85/80 | 70/65 | 55/50 | 75/70 | 71.3/66.3 |
Table II. Cells report SR/CSR (%) over 20 trials per task. The full method is always shown last.
Current-contact control. Replacing the future-tactile rollout with a direct scorer of current tactile history, proprioception, and candidate actions, while using the same diffusion sampling procedure, achieves 60.0% SR and 51.3% CSR over the four tasks, compared with 71.3% and 66.3% for ForeTac. This gap indicates an additional benefit from evaluating predicted future contact under this protocol.
Component analyses examine representation fidelity, action conditioning, prediction horizon, recorded and predicted future-touch ranking, and offline guidance diagnostics.
TacVAE is compared with PCA, PointNet-AE, and Conv-AE on the same held-out marker-displacement windows using reconstruction MAE and cosine similarity. Metrics use training-split channel statistics and are averaged over markers and frames, then windows. Lower MAE and higher cosine similarity are better.
| Encoder | Board | Vase | Card | Chip | ||||
|---|---|---|---|---|---|---|---|---|
| MAE ↓ | Cos. ↑ | MAE ↓ | Cos. ↑ | MAE ↓ | Cos. ↑ | MAE ↓ | Cos. ↑ | |
| PCA | 0.040 | 0.995 | 0.035 | 0.995 | 0.036 | 0.980 | 0.026 | 0.965 |
| PointNet-AE | 0.048 | 0.956 | 0.027 | 0.955 | 0.044 | 0.992 | 0.032 | 0.990 |
| Conv-AE | 0.055 | 0.997 | 0.042 | 0.994 | 0.104 | 0.999 | 0.036 | 0.959 |
| TacVAE | 0.039 | 0.998 | 0.037 | 0.975 | 0.031 | 0.999 | 0.015 | 0.899 |
Table III. TacVAE attains the lowest reconstruction MAE on Board, Card, and Chip. Its cosine similarity is highest on Board and Card but lower on Vase and Chip.
| Configuration | Latent MAE | Marker error |
|---|---|---|
| Aligned candidate action | 0.0589 | 0.2832 px |
| Action-masked control | 0.0941 | 0.5209 px |
Table IV. 20,055 windows from 23 held-out Board episodes, with errors averaged over all 16 future steps. Masking the action increases both errors, indicating that the predictor uses candidate-action information.
| L | Latent MAE | Latent cos. | Marker error | SR | CSR |
|---|---|---|---|---|---|
| 1 | 0.0485 | 0.9989 | 0.1973 px | 60% | 50% |
| 4 | 0.0498 | 0.9987 | 0.2147 px | 65% | 50% |
| 8 | 0.0534 | 0.9984 | 0.2443 px | 75% | 65% |
| 12 | 0.0563 | 0.9981 | 0.2650 px | 80% | 65% |
| 16 | 0.0589 | 0.9978 | 0.2832 px | 85% | 80% |
Table V. The predictor outputs 16 steps; only the first L steps are valid for scoring and guidance, and the remaining positions are masked. Prediction errors are averaged over the valid first L steps on held-out Board windows, while SR/CSR are measured in the corresponding Board rollouts. Under this fixed-scorer protocol, L=16 performs best among the tested settings.
| Task | Pairs | Recorded | Predicted | ρ |
|---|---|---|---|---|
| Board | 1980 | 1856/1980 (93.7%) | 95.1% | 0.9368 |
| Vase | 1012 | 936/1012 (92.5%) | 91.1% | 0.9728 |
| Card | 1408 | 1292/1408 (91.8%) | 94.2% | 0.9321 |
| Chip | 1240 | 1062/1240 (85.6%) | 89.5% | 0.9326 |
| Pooled | 5640 | 5146/5640 (91.2%) | 92.9% | -- |
Table VI. Recorded and predicted future-touch ranking on held-out contact-phase pairs. Recorded reports correct pairs and preference-order accuracy; predicted replaces recorded latents with aligned Foresight predictions. ρ is the rank correlation between score sets.
Using the same frozen scorer and positive–negative pairs, predicted inputs achieve 89.5–95.1% task-wise and 92.9% pooled preference-order accuracy, compared with 85.6–93.7% and 91.2% for recorded inputs. Task-wise rank correlations are ρ=0.9321–0.9728.
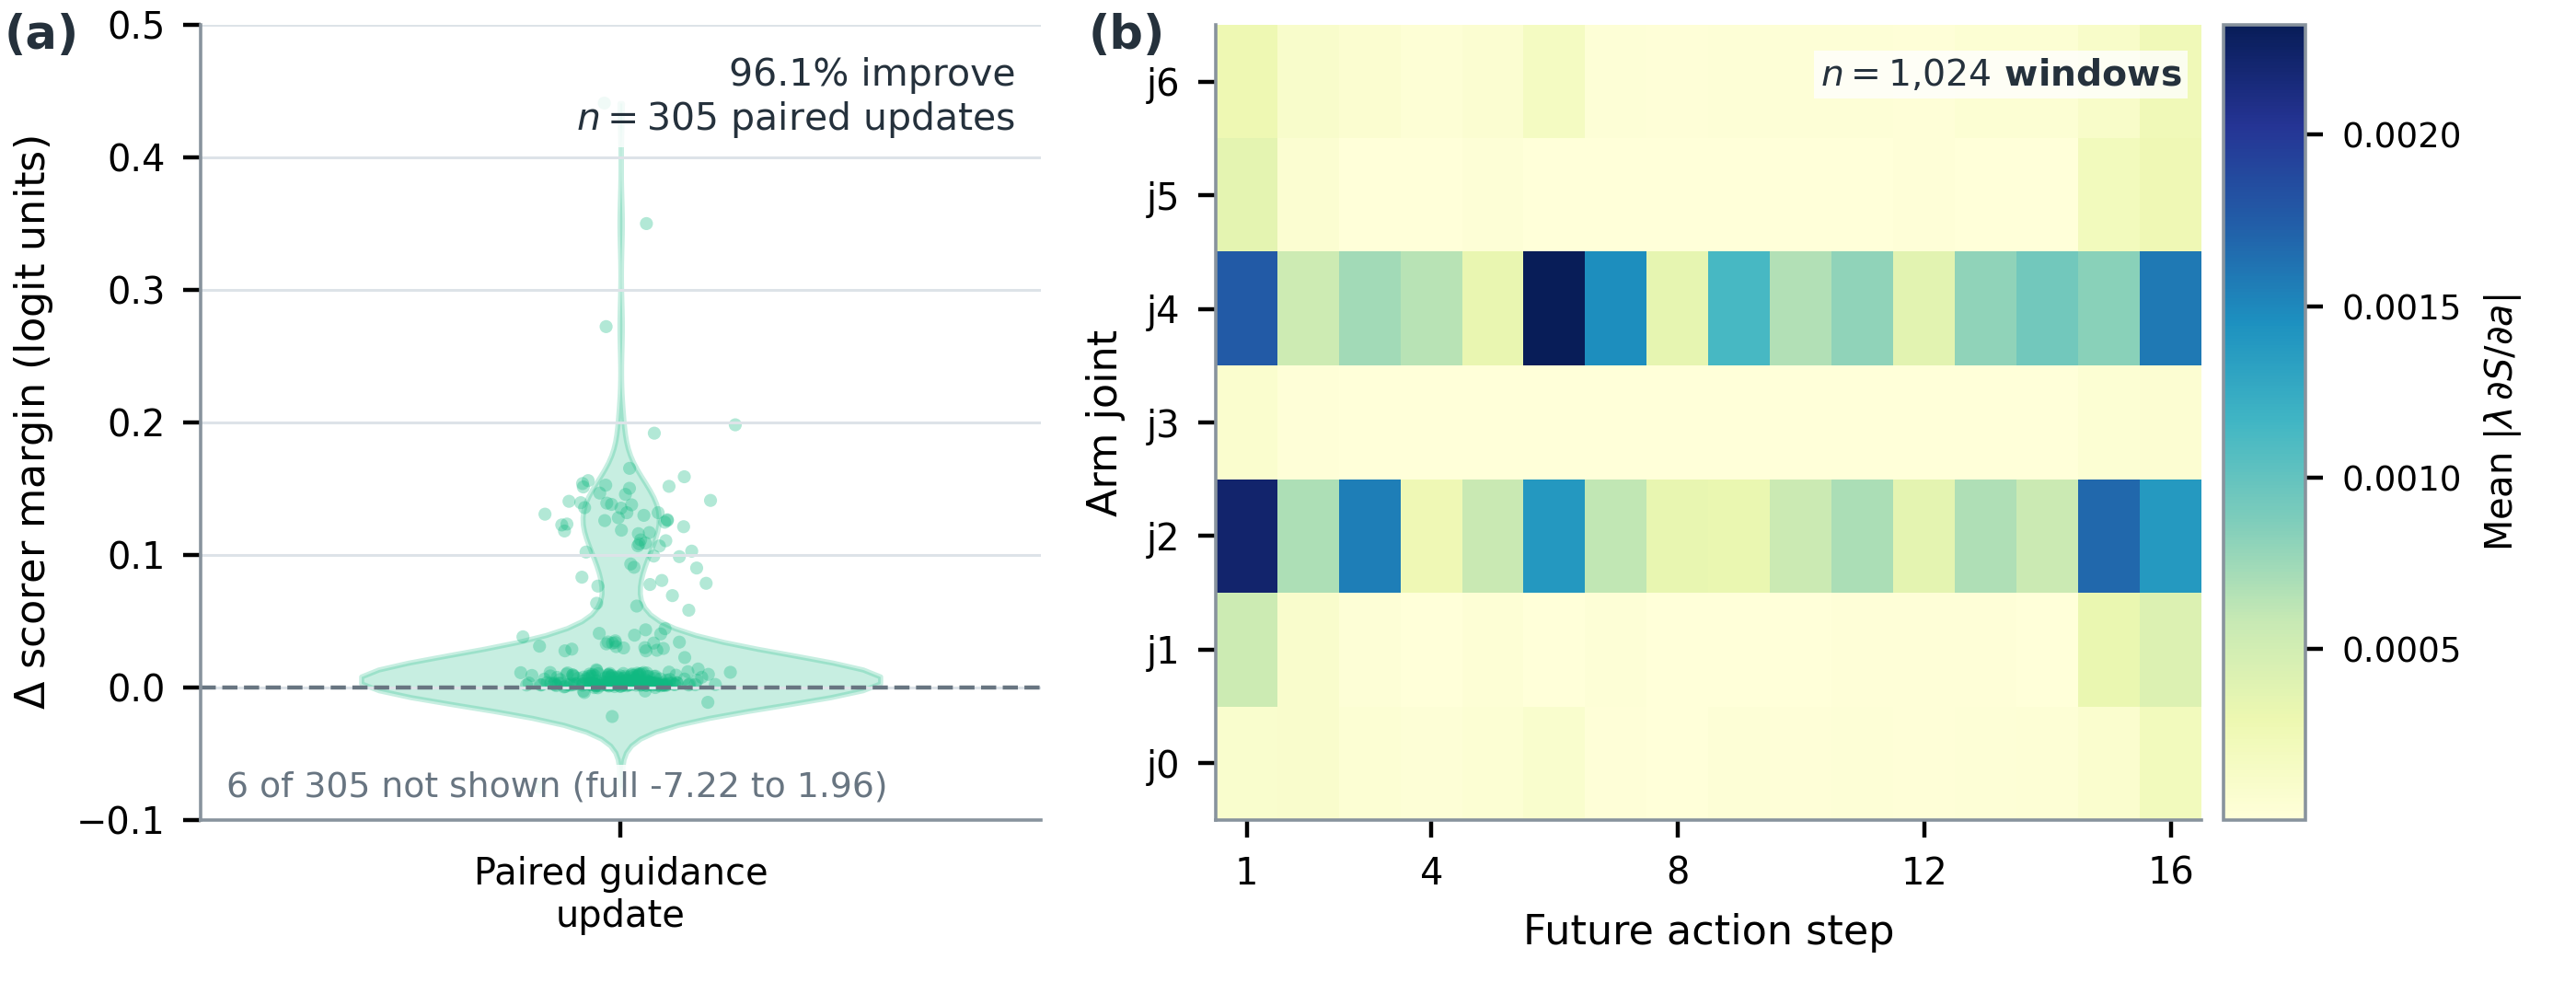
On an NVIDIA RTX 4090, batch-one replanning takes 261.26 ± 5.16 ms for ForeTac and 132.46 ± 1.39 ms for DP. These measurements use 50 warm-up replans followed by 200 synchronized timed replans. ForeTac therefore adds 128.80 ms per replan, mainly due to repeated tactile prediction, scoring, and gradient computation during guided sampling.
| Configuration | Base (M) | Added (M) | Total (M) | Latency (ms) |
|---|---|---|---|---|
| DP | 338.043 | 0 | 338.043 | 132.46 ± 1.39 |
| DP + Foresight | 338.043 | 34.069 | 372.113 | 134.98 ± 1.21 |
| DP + Foresight + Scorer | 338.043 | 34.922 | 372.965 | 135.35 ± 0.86 |
| ForeTac (10 guided steps) | 338.043 | 34.922 | 372.965 | 261.26 ± 5.16 |
Supplementary computational analysis (DP backbone). Parameter counts are in millions. Latency is mean ± standard deviation over 200 CUDA-synchronized timed replans after 50 warm-ups, on an RTX 4090 with batch size 1, a 16-step action horizon, and 30 DP denoising steps. The intermediate configurations run the added modules once per replan; full ForeTac repeats prediction, scoring, and backpropagation at 10 guided sampling steps. Timing includes observation encoding, action generation, and all enabled ForeTac computations.
The four benchmark tasks span sustained planar contact, changing contact geometry, constrained sliding, and fragile-object interaction. Execution videos are shown alongside tactile visualizations with paired playback. Board, Vase, and Card marker panels show predictions; Chip and Visual Perturbation marker panels show recorded displacements. Force curves use processed replay signals in native units, and the displayed score is a visualization proxy. The additional rows provide qualitative demonstrations and prediction diagnostics.
Four benchmark tasks
Board wiping tests contact establishment and maintenance on a planar surface.
Vase wiping tests contact transfer under changing surface geometry.
Card swiping evaluates constrained sliding with continuous contact and alignment.
Fragile chip grasping exposes the narrow operating range between insufficient force, which causes slip or drop, and excessive force, which may damage the object.
Additional qualitative demonstration
Card swiping under visual disturbance, shown alongside recorded tactile observations.
Prediction diagnostic
An independent t+16 diagnostic compares future ground-truth marker fields with predicted tactile outcomes as a supplementary visualization.
@article{foretac2026,
  title     = {ForeTac: Predictive Contact Guidance for Generative Robot Policies},
  author    = {Anonymous},
  journal   = {Under Review},
  year      = {2026}
}